Dave Thompson December 15, 2025 840 Views
Client retention metrics are the numbers that tell you how good your agency is at keeping clients around. Think of them as the vital signs of your business—KPIs like churn rate and customer lifetime value directly reflect client satisfaction and provide a clear window into future revenue. In fact, research from Zendesk shows that 81% of consumers say a positive customer service experience increases the chances they’ll make another purchase.
Why Client Retention Is Your Agency’s True Growth Engine
Client acquisition gets all the glory, but the real secret to sustainable agency growth is retention. It’s a complete shift in mindset. Instead of frantically pouring new clients into a leaky bucket, you focus on plugging the holes and making the bucket stronger. This isn’t just about being friendly; it’s a core financial strategy.
Imagine your agency is a high-performance aircraft. Your client retention metrics are the instruments in the cockpit. Each gauge is telling you something critical:
- Churn Rate: That’s your altitude warning, screaming when you’re losing clients and dropping fast.
- Customer Lifetime Value (CLV): This is your fuel gauge, showing you the total revenue you can expect from a client over time.
- Retention Rate: This is your engine’s health indicator, showing overall stability and performance.
Without these instruments, you’re flying blind. You’re just reacting to turbulence as it hits instead of navigating a clear path around it. Tracking these numbers is what turns your agency from a reactive service provider into a proactive, strategic partner.
The Financial Power of Loyalty
The financial upside of keeping clients is staggering. A minor improvement in retention can accelerate your profitability to sky-high levels. Research consistently shows that a mere 5% increase in customer retention can drive profit growth from 25% to as high as 95%.
This massive return comes from a simple truth: acquiring a new customer can cost up to seven times more than keeping an existing one. Loyal clients don’t just stick around; they become more valuable over time. They trust you enough to try new services, opening the door for upsells and expansion opportunities that fuel growth without the sky-high cost of acquisition.
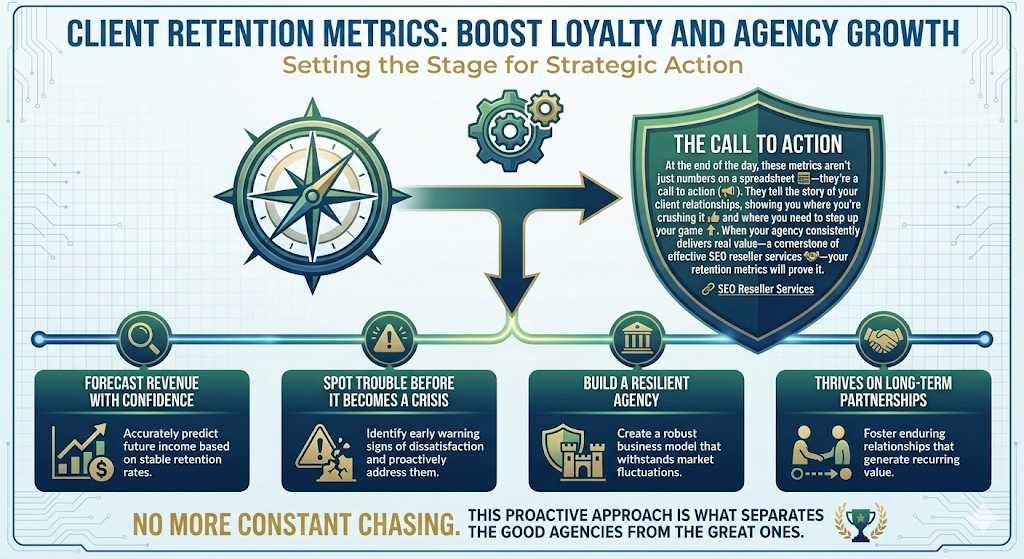
Setting the Stage for Strategic Action
At the end of the day, these metrics aren’t just numbers on a spreadsheet—they’re a call to action. They tell the story of your client relationships, showing you where you’re crushing it and where you need to step up your game. When your agency consistently delivers real value—a cornerstone of effective SEO reseller services—your retention metrics will prove it.
By truly understanding and acting on these vital signs, you can forecast revenue with confidence, spot trouble before it becomes a crisis, and build a resilient agency that thrives on long-term partnerships. No more constant chasing. This proactive approach is what separates the good agencies from the great ones.
The Four Foundational Client Retention Metrics
If you’re ready to move past guesswork and get a clear picture of your agency’s health, you need to master a few essential numbers. These aren’t just abstract figures for a spreadsheet; they’re the core diagnostic tools that tell you exactly how strong your client relationships are.
By wrapping your head in these four foundational client retention metrics, you can commence making data-driven decisions that build genuine loyalty and fuel sustainable growth.
This model breaks down the direct line between keeping clients happy and seeing your agency thrive. It all starts with satisfaction.
As you can see, retention is the engine that converts client happiness into long-term financial health for your agency. It’s where the magic happens.
To give you a head start, here’s a quick rundown of the metrics we’re about to unpack.
Quick Guide to Foundational Retention Metrics
This table provides a snapshot of key metrics, what they measure, and the simple formulas to calculate them for your agency.
| Metric Name | What It Measures | Formula |
|---|---|---|
| Client Retention Rate (CRR) | The percentage of clients who stayed with you over a specific period. | [ (End Clients – New Clients) / Start Clients ] x 100 |
| Churn Rate | The percentage of clients who left your agency during a period. | ( Lost Clients / Start Clients ) x 100 |
| Repeat Purchase Rate (RPR) | The percentage of clients who returned to buy another service or project. | ( Returning Clients / Total Clients ) x 100 |
| Customer Lifetime Value (CLV) | The total revenue you can expect from a single client throughout their entire relationship. | Average Annual Value x Average Lifespan |
These formulas are your starting point. Now, let’s look at what each one really tells you about your business.
Client Retention Rate: The Big Picture
Your Client Retention Rate (CRR) is the most straightforward measure of loyalty you have. It tells you, as a simple percentage, how many clients stuck around over a given period. Think of it as your agency’s stability score.
A high CRR is a sign that you’re consistently delivering value and keeping the people who pay your bills happy.
To figure it out, you need three numbers for your chosen timeframe (like a quarter or a year):
- S: How many clients did you have at the start?
- E: How many clients did you have at the end?
- N: How many new clients did you sign during that time?
The formula is clean and simple:
CRR = [ (E – N) / S ] x 100
Let’s say you started the quarter with 50 clients, landed 10 new ones, and ended with 55 clients on your roster. Your retention rate would be 90%.
[ (55 - 10) / 50 ] x 100 = 90%
This single number can grant you a powerful benchmark to track month over month and quarter over quarter.
Churn Rate: The Leaky Bucket Metric
While retention rate tells you who stays, Churn Rate tells you who leaves. It’s the percentage of clients who walked away during a specific period. This is the classic “leaky bucket” metric—it shows you how fast you’re losing water.
Even a small monthly churn rate that seems harmless can have a devastating compounding effect over the year. A seemingly low 3% monthly churn rate translates to losing over 30% of your clients annually.
Calculating churn is just as easy:
- L: The number of clients you lost.
- S: The number of clients you started with.
The formula is:
Churn Rate = ( L / S ) x 100
So, if you started the month with 50 clients and lost 2, your monthly churn is 4%.
( 2 / 50 ) x 100 = 4%
Keeping a close eye on your churn rate is non-negotiable. A rising number is an early warning siren that something in your service, communication, or results is starting to fail.
Repeat Purchase Rate: Loyalty in Action
For agencies that juggle project-based work or offer a list of different services, the Repeat Purchase Rate (RPR) is a fantastic gauge of client trust. It measures the percentage of your clients who came back for more.
A high RPR means clients didn’t just like the first thing you did for them—they trust you enough to put more money on the table.
Here’s the math:
- C_repeat: The number of clients who made more than one purchase.
- C_total: The total number of unique clients you served.
The formula is:
RPR = ( C_repeat / C_total ) x 100
If 100 unique clients hired you this year and 35 of them came back for a second project, your RPR is 35%. It’s a strong signal of future loyalty and a great way to measure the immediate value you’re providing.
Customer Lifetime Value: The True Worth of a Client
Customer Lifetime Value (CLV) is easily the most strategic metric of the bunch. It shifts the focus from a single project’s revenue to the total amount of money you can realistically expect from a client over your entire relationship.
Understanding CLV helps you make smarter decisions about everything—from how much you spend on marketing to how much you invest in keeping current clients happy. After all, a business can’t survive if it costs more to get a client than they’re worth.
While there are some seriously complex CLV models out there, a simple and effective formula for most agencies is:
CLV = Average Annual Client Value x Average Client Lifespan (in years)
If your average client pays you $24,000 a year and typically sticks around for 3 years, their CLV is a cool $72,000.
This metric entirely shifts your perspective. Instead of viewing clients as monthly transactions, you begin to see them as long-term assets. This approach naturally leads to focusing on relationship-building and proactive service, as even a slight increase in client retention can significantly enhance a white label SEO company’s profitability.
Taken together, these four metrics give you a comprehensive health dashboard for your agency. As our guide on why measurement is key to agency success explains, tracking them isn’t just about numbers—it’s about building a predictable, resilient business.
Bringing Your Retention Metrics to Life
Running the numbers on your client retention metrics is a solid first step, but let’s be honest—on their own, they’re just data points on a screen. To make them mean something, you need to wrap them in context, discover a sustainable tracking rhythm, and build a system that doesn’t make you want to pull your hair out. This is where raw data turns into real, actionable intelligence.
A unified dashboard isn’t just a nice-to-have; it’s the command center for your agency’s health. It’s where your metrics stop being historical records and start guiding the decisions you make every single day.
Setting Realistic Benchmarks
One of the first questions I always hear from agency owners is, “What’s a good retention rate?” It’s a fair question, but comparing your agency to broad industry averages can be like comparing apples to oranges. Client loyalty works differently depending on the business you’re in.
For example, client retention metrics vary wildly across different sectors. Industries such as media and professional services often have high average retention rates around 84%, which makes sense given their ongoing, relationship-based work. On the flip side, hospitality and travel hover closer to 55% because the nature of the business is more transactional. Meanwhile, financial services sit at a respectable 78%.
The most important benchmark for your agency is its own historical performance. Your goal shouldn’t be to hit a generic industry number, but to achieve consistent, quarter-over-quarter improvement in your own metrics.
Focus on your own trendline. An agency whose retention rate slips from 95% to 85% has a much bigger problem on its hands than a competitor who has consistently held steady at 80%. Your past performance is the only context that truly matters for your future goals.
Finding the Right Tracking Cadence
Not all client retention metrics deserve the same level of attention. If you try to monitor everything daily, you’ll burn out and get lost in the noise—a classic case of analysis paralysis. The real trick is to establish a rhythm that matches every metric’s strategic importance.
Here’s a practical cadence that works well for most growing agencies:
- Daily/Weekly: Keep an eye on the leading indicators of client health, including support ticket volume, how often you’re hearing from a client, and whether project milestones are being hit on time. A client who’s usually chatty is suddenly going silent? That’s a red flag.
- Monthly: This is the time to review your core operational metrics. Monthly, calculate your Churn Rate and Client Retention Rate. It’s frequent enough to catch a negative trend before it spirals into a quarterly crisis.
- Quarterly: Step back and look at the big picture with your strategic, long-term metrics. Customer Lifetime Value (CLV) and other growth indicators are best reviewed every three months. These numbers will shape your high-level planning, budget, and growth forecasts.
Taming the Data Chaos with a Unified Dashboard
For many agencies, the biggest obstacle to tracking metrics isn’t the math—it’s the chaos. Critical data is scattered everywhere. Client start dates live in your CRM, billing info is in QuickBooks, project updates are in Asana, and support tickets are buried in a helpdesk tool.
Every month, trying to stitch everything together manually is a recipe for disaster. It’s tedious, time-consuming, and practically guarantees human error. While some agencies use tools like HubSpot or Salesforce, these often require extensive customization. This is why a centralized, white-label dashboard built for agencies is such a game-changer.
A solution like Agency Platform was built to solve this exact problem. It automatically pulls all that scattered data into one unified view, doing the heavy lifting and complex calculations for you. Instead of wasting hours wrestling with spreadsheets, you get a real-time, single source of truth that keeps a constant pulse on your agency’s health. This frees you up to focus on what actually moves the needle: analyzing the insights and taking action to keep your clients happy and your agency growing.
From Insights to Action: How to Improve Your Numbers
Understanding your client retention metrics is like looking at the scoreboard—it tells you if you’re winning or losing. But the numbers themselves don’t score points. This is where you shift from being a passive observer to an active player, turning those insights into a playbook that builds stronger client relationships and fuels real growth.
The trick is to connect the problems your data uncovers with proven, actionable solutions. Think of your metrics as the diagnosis; these next strategies are the cure.
Diagnose and Treat High Early Churn
Is your churn rate spiking within the first 90 days of a new client partnership? This is one of the most common and fixable problems agencies can suffer. More often than not, it points directly to a breakdown during onboarding time.

A rocky start erodes confidence and has clients questioning their investment before they even see a glimmer of results. To fix this, you need to overhaul your onboarding with a sharp focus on immediate impact and crystal-clear communication.
- Set Clear Expectations: From the very first conversation, define what success looks like and map out a realistic timeline for key milestones. No surprises.
- Secure an Early Win: Find a quick, high-impact goal you can knock out within the first 30 days. This builds momentum and proves your value.
- Over-Communicate: Send regular, proactive updates. Even a brief check-in to say “all is on track” shows you’re engaged and on top of their account.
Revitalize a Stagnant Customer Lifetime Value
If your Customer Lifetime Value (CLV) has flatlined, you’re leaving money on the table. It’s a sign that your clients are happy enough to stick around, but they aren’t growing with you.
The solution is to create structured opportunities for upselling and cross-selling that feel like a natural next step, not a pushy sales pitch. Map out your services and identify which offerings are logical add-ons for your agency. For instance, a client who’s thrilled with their SEO results is a perfect candidate for a content marketing retainer to make it worse. When you proactively present these opportunities, you not only increase revenue per client but also deepen the partnership.
Create a Proactive Retention Culture
The ultimate goal is to stop firefighting and start building a proactive culture of retention. This means empowering your team to step in before a client becomes a churn risk. A unified dashboard isn’t just for analysis; it’s a tool for action.
A dashboard like Agency Platform doesn’t just show you data; it empowers your team to intervene at the right moment. Centralizing your client retention metrics transforms your ability to get ahead of problems.
Imagine setting up automated alerts that flag an account when engagement dips, or when a client hasn’t logged into their portal in over a week. That simple notification can trigger a check-in call that turns a minor issue into a non-issue.
Your dashboard can also help you spot your biggest fans—the clients with the highest satisfaction scores and longest tenures. These are your prime candidates for a new referral program, turning their success into your next business opportunity. This is how you close the loop, using data not just to keep clients, but to find more just like them. For more ideas, check out our guide on 8 powerful customer retention strategies.
Common Questions About Client Retention Metrics
Once agencies start digging into their data, a flood of practical questions always follows. I get it. Understanding your client retention metrics is a journey, and having clear answers to the usual sticking points can turn confusion into clarity. This section tackles the most common questions I hear from agency leaders just like you.
Think of this as your cheat sheet for navigating the strategic and operational hurdles of putting a retention-focused strategy into practice.
What Is a Good Client Retention Rate for an Agency?
This is the big one. While benchmarks can shift depending on your niche, a solid client retention rate for most marketing or professional services agencies hovers between 80% and 85%. If you’re hitting numbers north of 90%, you’re in elite territory—that’s a clear sign you’re delivering incredible value.
But here’s the thing: the most important benchmark is your own history. Your real goal should be steady, quarter-over-quarter improvement. Seeing your retention dip from 92% to 85% might still look “good” on paper, but it’s an early warning flare that you need to investigate right away.
How Often Should I Calculate My Retention Metrics?
The right cadence depends entirely on the metric. Trying to watch everything every single day is just a recipe for burnout and analysis paralysis. Instead, find a practical rhythm that works for you.
- Leading indicators, such as client engagement scores or the number of support tickets, should be on your radar constantly or at least weekly. These are your canaries in the coal mine.
- Core operational metrics, such as Churn Rate and Client Retention Rate, are best reviewed regularly. This gives you enough time to spot a trend before it snowballs into a crisis.
- Strategic, long-term metrics, such as Customer Lifetime Value (CLV), make the most sense to analyze quarterly as part of your bigger-picture planning.
A good centralized dashboard makes this easy, keeping these numbers visible even if your formal sit-down reviews are less frequent.
Which Single Retention Metric Is Most Important?
While all these metrics work together to tell a complete story, there’s a definite pecking order when you’re just starting. If you’re new to this, nail down your Client Churn Rate first. It’s the most direct and unforgiving indicator of client unhappiness and revenue walking out the door. It tells you exactly how fast your bucket is leaking.
Once you have the churn under control and stable, your focus should immediately pivot to a growth-oriented metric, CLV or upsell rate. Why? Because these are powerful growth levers. They don’t just measure if you can keep clients—they measure if you can grow the revenue you get from them. This is the ultimate proof that your agency is built to scale.
How Can I Track Metrics Without a Dedicated Tool?
You can absolutely get started with a simple spreadsheet. By exporting data from your CRM and your billing software, you can manually calculate your Client Retention Rate and Churn Rate. Honestly, this is a fantastic first step and helps build a data-aware culture in your team.
The actual problem is that this manual approach is getting older. As your agency grows, it becomes a massive time-suck and prone to human error. This is the natural inflection point where investing in a specialized tool isn’t just a nice-to-have; it’s essential.
A dedicated platform takes the tedious, repetitive work of data collection off your plate, guarantees accuracy, and gives you the real-time insights needed to make smart, proactive decisions. It transforms data from a chore into a strategic advantage.
This is exactly where a solution built for agencies really shines. A platform like Agency Platform handles the manual grind so you can return to focusing on strategy, not spreadsheets.
Ready to stop reacting to churn and start proactively building retention? Agency Platform provides a fully white-label dashboard that automates your metric tracking, centralizes client data, and surfaces the actionable insights you need to keep clients happy and fuel real growth. See how hundreds of agencies are building more profitable, predictable businesses. Schedule your free demo today!