Dave Thompson September 29, 2026 32 Views
SEO client dashboards aren’t just reporting screens anymore. They’re the system that helps an agency prove business value when rankings, traffic, conversions, and now AI-era visibility don’t always move in a straight line. The strongest dashboards keep the view focused, tie SEO work to client goals, and show what changed, why it matters, and what happens next. If you’re building your first white label SEO reporting system, start with strategy, not widgets.
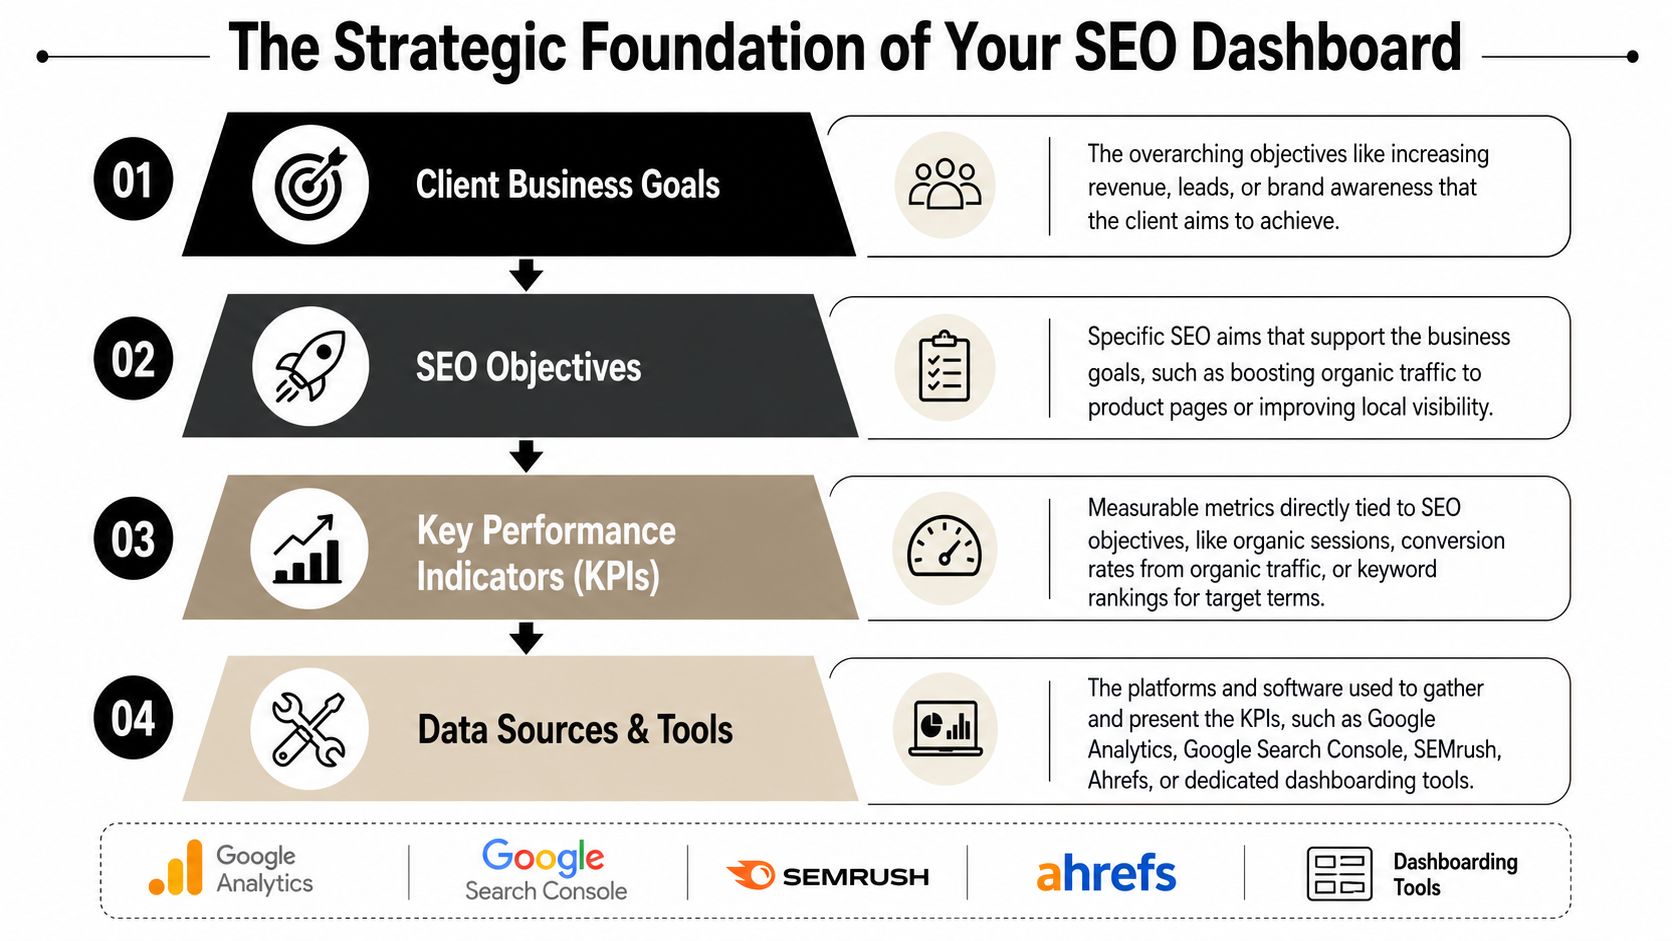
The Strategic Foundation of Your SEO Dashboard
A useful dashboard works like a cockpit. The right dials depend on the destination. A local service business that needs booked calls should not see the same primary view as an ecommerce brand focused on landing-page revenue or a franchise group trying to improve local visibility across locations.
That’s why the first decision isn’t the tool. It’s the definition of success.
Start with business outcomes
Most clients ask for “more traffic.” That sounds clear, but it usually isn’t. In practice, they mean one of four things: more qualified leads, more revenue, more local market share, or better brand visibility in search.
Before a dashboard is built, pin down these questions:
-
Revenue question What actions on the site matter most. Form fills, booked calls, purchases, quote requests, or store visits.
-
Sales question Which pages or query themes attract people close to buying, not just browsing.
-
Local question Whether visibility needs to be measured by geography, service line, or location page.
-
Stakeholder question Who will read the dashboard. An owner wants summary and direction. A marketing manager wants patterns and next actions.
If you skip this step, you end up with a polished report that clients still don’t trust.
Separate vanity metrics from proof
The common metrics in seo client dashboards still matter. Databox notes that dashboard staples include keyword rankings, organic traffic, organic conversions, and new or lost backlinks, while also recommending a dashboard stay focused to a maximum of 9 metrics even though platforms can connect to 130+ data sources (Databox SEO client dashboard guidance). That’s the right instinct. More data sources should reduce manual work, not increase client confusion.
A practical way to frame KPI discovery is to move down this ladder:
| Layer | Good question | Better dashboard metric |
|---|---|---|
| Business goal | What does growth mean here | Leads, sales, booked calls |
| SEO objective | What must SEO improve | Visibility to money pages, local presence |
| KPI | How will we know it worked | Organic conversions, landing-page conversion rate, rankings for priority terms |
| Diagnostic metric | Why did performance move | CTR, impressions, backlinks, technical health |
Practical rule: If a metric can’t support a decision, it probably doesn’t belong on the first page.
Add narrative or expect misunderstanding
Raw charts don’t retain clients. Interpretation does.
SEO reporting guidance consistently recommends tailoring KPIs to the client’s goals and adding narrative context so reports explain what changed, why it matters, and what happens next (SE Ranking reporting guidance). That’s especially important when rankings improve but conversions lag, or when local visibility rises before lead flow catches up.
A simple monthly note often does more than another graph:
-
What changed Brand and non-brand visibility moved differently.
-
Why it matters More qualified traffic reached service pages.
-
What happens next The next sprint focuses on pages with strong impressions but weak conversion support.
That turns a dashboard from proof-of-activity into proof-of-management.
Selecting and White-Labeling Your Dashboard Platform
Tool selection is an operations decision disguised as a reporting decision. Agencies often evaluate platforms by chart types, but the key consideration is whether the system reduces reporting labor, keeps branding consistent, and scales without turning account managers into spreadsheet mechanics.
What actually matters in platform selection
A dashboard platform should solve three agency problems at once:
-
Data consolidation Pull search, analytics, rankings, leads, and task progress into one layer.
-
Brand control Let you present the experience under your own logo, colors, domain, and client-facing communication.
-
Repeatability Make it easy to launch the same reporting standard across many accounts without rebuilding every view from scratch.
The trade-off is straightforward. A custom stack gives flexibility but adds maintenance. An all-in-one platform gives speed and consistency but asks you to work within a system.
For most agencies, the white-label decision should come down to this table:
| Option | Strength | Risk |
|---|---|---|
| Custom dashboard stack | Flexible layouts and custom blends | More setup, more upkeep, more training |
| Reporting tool only | Faster launch | Separate tools still create workflow friction |
| White-label platform | Unified brand and process | Less bespoke than fully custom builds |
White-labeling is part of the client experience
Clients don’t judge dashboards the way SEOs do. They notice whether the experience feels coherent. A branded login, clean report URL, consistent emails, and familiar visual language make the reporting layer feel like part of your service, not borrowed software.
That matters more than agencies admit. A dashboard is often the most visible artifact of ongoing work between strategy calls.
One option in this category is Agency Platform’s white-label dashboard, which is built for agencies that want a brandable reporting layer tied to broader fulfillment and account management. The main value of a setup like that isn’t just presentation. It’s reducing the gap between execution, reporting, and client communication.
A dashboard should feel like your operating system for the account, not a monthly attachment with better design.
Don’t buy features you won’t operationalize
Agencies often overbuy. They pay for connectors, exports, and custom views they never turn into client-facing value.
A better selection test is practical:
-
Can the team onboard a new client quickly
-
Can account managers explain the metrics without analyst support
-
Can reports stay consistent across local SEO, national SEO, and multi-location clients
-
Can clients see only what’s relevant to them
If the answer is no, the platform may be powerful, but it isn’t useful.
Configuring Your Dashboard for Maximum Client Value
Most dashboards fail because they show everything the platform can pull. Clients don’t need that. They need a clear view of business impact first, then the supporting explanation.
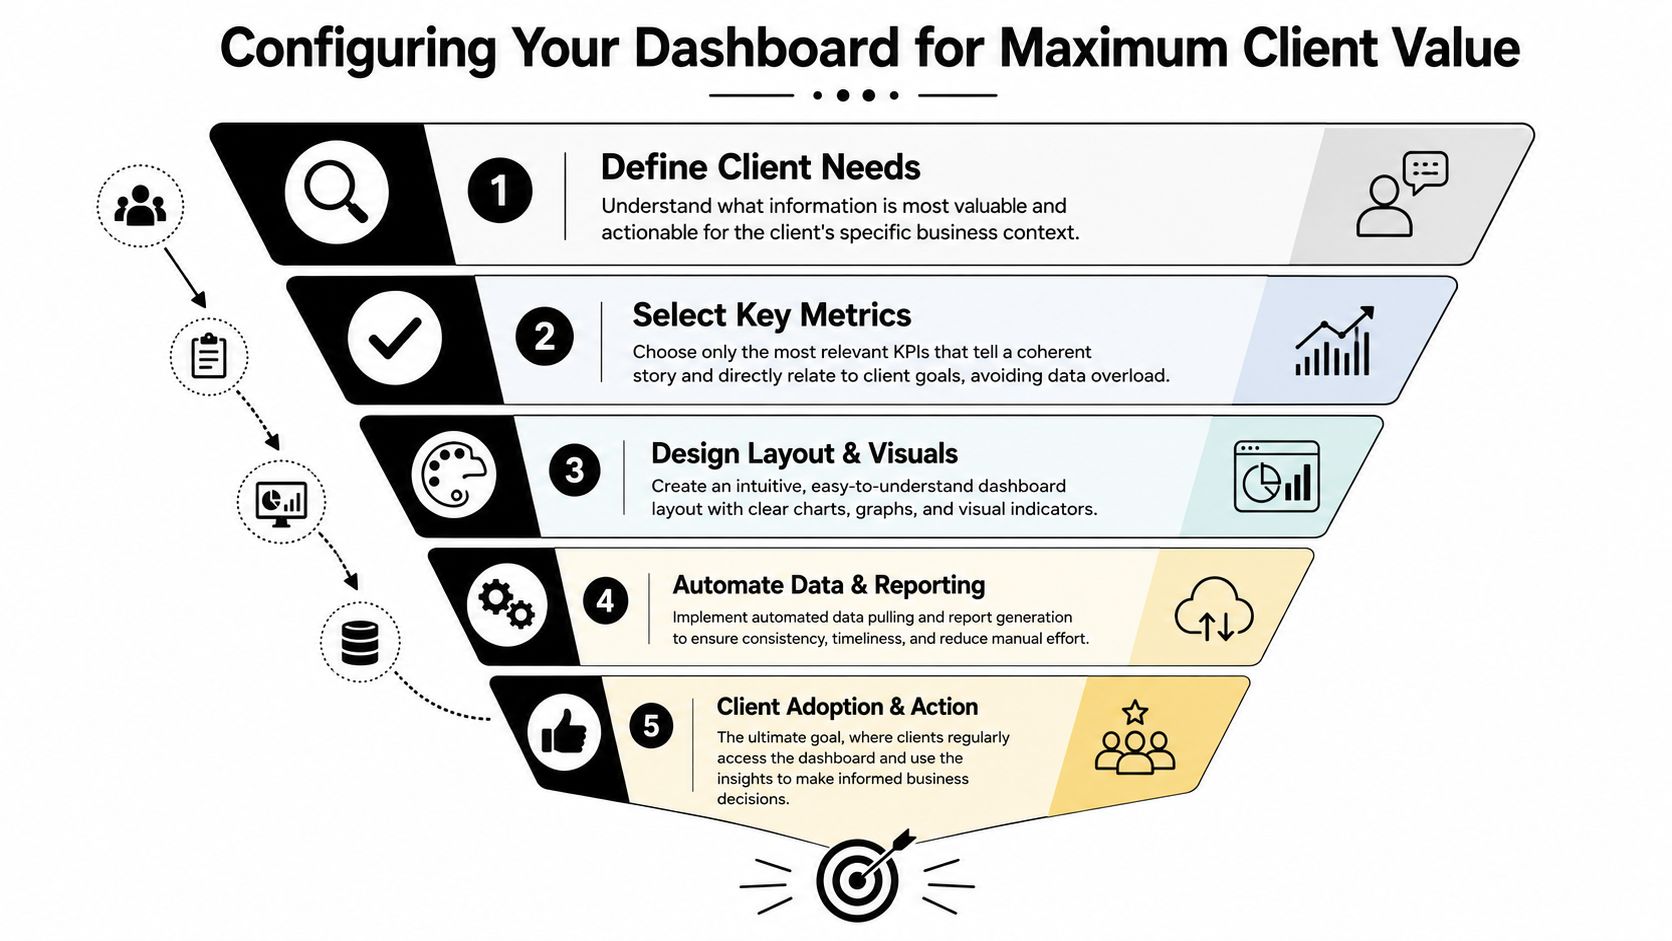
Build the first screen like an executive summary
The top of the dashboard should answer one question fast: is SEO helping the business?
Keep the first panel tight. In most client views, that means a scorecard row and a short summary block. I prefer business outcomes first, then SEO context second.
A strong top section usually includes:
-
Outcome metrics Organic conversions, leads, purchases, or booked calls
-
Traffic context Organic sessions or traffic trend
-
Visibility context Clicks, impressions, average position, or rankings
-
Decision note A short narrative on movement and next actions
Many dashboards falter at this point. They open with rankings or impressions and force the client to guess whether performance mattered.
Blend SEO metrics with business outcomes
A technically strong setup should connect Google Search Console and GA4, then combine proxy SEO metrics like clicks, impressions, average position, and CTR with business outcomes like sessions and conversions so landing pages can be judged on both visibility and revenue impact (Looker Studio dashboard guidance via Improvado).
That blended view changes the conversation. A page with high impressions but weak conversions needs a different response than a page with fewer visits but strong lead quality.
Use a funnel-like layout:
| Dashboard section | What it shows | Why it matters |
|---|---|---|
| Scorecards | Top-line KPIs | Immediate business status |
| Top pages | Traffic and conversion rate by landing page | Which pages create value |
| Opportunity pages | High impressions, low CTR pages | Where optimization can unlock demand |
| Technical health | Core Web Vitals, indexation, site issues | What may block growth |
The client doesn’t need every metric. They need the few metrics that explain performance and the few diagnostics that justify action.
Design for reading, not just reporting
Layout affects adoption more than agencies expect. A dashboard that reads top to bottom tends to get used. A dashboard that looks like a control room gets skimmed once and ignored.
A few configuration choices consistently work better than others:
-
Group metrics by decision type Visibility, engagement, and conversion metrics should not be mixed randomly.
-
Keep labels plain “Organic conversions from service pages” is better than a platform-default field name.
-
Use comparisons carefully Month-over-month can be helpful, but only when the business understands seasonal context.
-
Reserve technical detail for lower sections Technical SEO matters, but it shouldn’t dominate the opening view unless the campaign is fixing a major issue.
For local SEO clients, add segmentation that reflects how they sell. That might be by location page, city cluster, or service category. For multi-location brands, this is often the difference between a useful dashboard and a generic one.
Avoid the data-dump trap
A dashboard becomes a data dump when every metric has equal weight. That’s usually a sign the agency built it from source availability instead of client priorities.
What works instead is selective disclosure. Show the result, then the evidence, then the cause. If a client wants deeper detail, give them another page or filtered view.
That approach keeps the dashboard readable and protects the agency from spending review calls explaining why one noisy metric moved for reasons that don’t change the strategy.
Running Your Dashboard Operations and Onboarding Clients
A dashboard starts proving value during onboarding, not after three months of reporting. The handoff matters. If the client sees it as a passive report, they’ll ignore it. If they see it as the live operating view of their campaign, they’ll use it.
A simple onboarding scenario that works
Take a new local business client. The kickoff call usually includes the owner, an office manager, and sometimes a marketing coordinator. Each person wants different answers.
The owner wants the summary. The office manager cares about lead flow. The marketing contact wants to know what the agency is doing and how to spot progress.
So the rollout should mirror that:
-
Kickoff demo Walk through the first page only. Show what matters now.
-
Role-based access Give stakeholders views matched to their role, not the whole reporting backend.
-
Scheduled summaries Send a recurring recap so the dashboard supports the relationship without requiring the client to remember to log in.
Real-time views changed the service model
A major shift in seo client dashboards was the move from delayed monthly PDFs to real-time, centralized reporting. Modern dashboards combine keyword rankings, organic traffic, backlinks, and conversions in one place and group them into visibility, engagement, and conversion views, which changes SEO from retrospective reporting into active management (AgencyAnalytics dashboard overview).
That shift changes agency behavior too. Teams can catch drops sooner, explain movement faster, and use reporting as part of account management instead of month-end cleanup.
When a dashboard is live, the monthly review stops being “what happened?” and becomes “what are we doing next?”
Build an operating rhythm around the dashboard
The reporting cadence should have two layers.
First, keep the dashboard live and available. Second, pair it with a scheduled summary that interprets movement. Clients rarely need more raw access. They need more clarity.
A practical operating rhythm looks like this:
| Cadence | Purpose |
|---|---|
| Live dashboard | Ongoing visibility and trust |
| Weekly internal review | Agency checks anomalies and opportunities |
| Monthly client summary | Interpretation, context, next actions |
For resellers and agencies managing many accounts, this rhythm reduces back-and-forth email because common questions are answered before they’re asked.
Advanced Strategies for Resale and Packaging
A dashboard isn’t just overhead. Handled correctly, it becomes part of the offer you sell, retain, and expand.
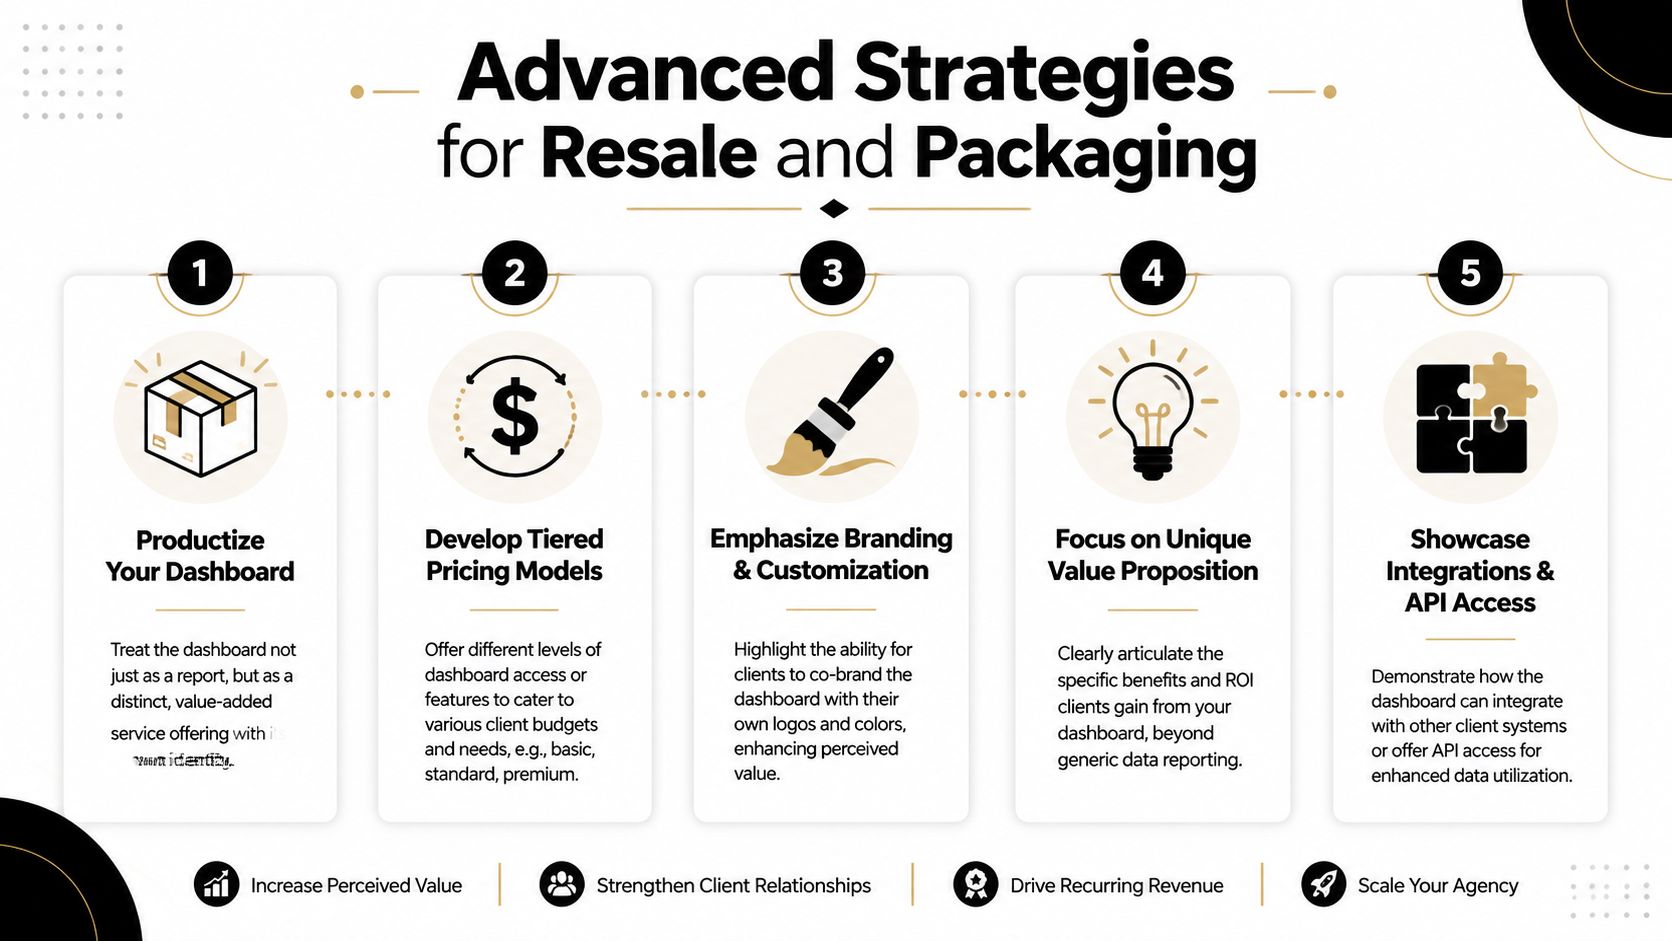
Productize the reporting layer
Agencies get into trouble when reporting is treated as free admin work. Clients may not pay for “a dashboard,” but they will pay for clearer decision-making, faster communication, and more transparent campaign management.
That’s why packaging matters. The dashboard should be framed as part of a managed service, not a courtesy add-on.
Three common packaging models work well:
-
Lite reporting Summary dashboard, scheduled report delivery, core KPIs
-
Managed reporting Dashboard plus monthly interpretation and planning
-
Strategic reporting Custom views, stakeholder-specific access, and deeper consulting time
Tie packaging to service complexity
Local SEO clients usually need a simpler view than enterprise or multi-location accounts. The dashboard package should reflect that difference.
A useful way to price the reporting layer is by complexity, not by chart count:
| Package logic | Best fit |
|---|---|
| Single location or simple lead gen | Streamlined KPI dashboard |
| Multi-service or multi-location business | Segmented dashboard with local views |
| Reseller or enterprise account | White-label, multi-user, deeper customization |
Sell the outcome, not the interface
Clients don’t stay because the graphs look good. They stay because the dashboard helps them understand progress without waiting on explanations for every fluctuation.
That’s the commercial shift agencies need to make. Reporting isn’t a cost center when it improves retention, reduces friction, and supports upsells into local SEO, content, paid media, or web work.
Future-Proofing Your Reporting for the AI Search Era
Traditional SEO dashboards assume clicks are the cleanest proof of value. That assumption is getting weaker.
Google said AI Overviews have expanded to more than 1.5 billion users, and the same discussion notes that studies in 2024 and 2025 found significant click-through drops on informational queries when AI Overviews appear (Ranked analysis of AI-era dashboard design). If your dashboard reports only sessions, it can make strong visibility look like failure.
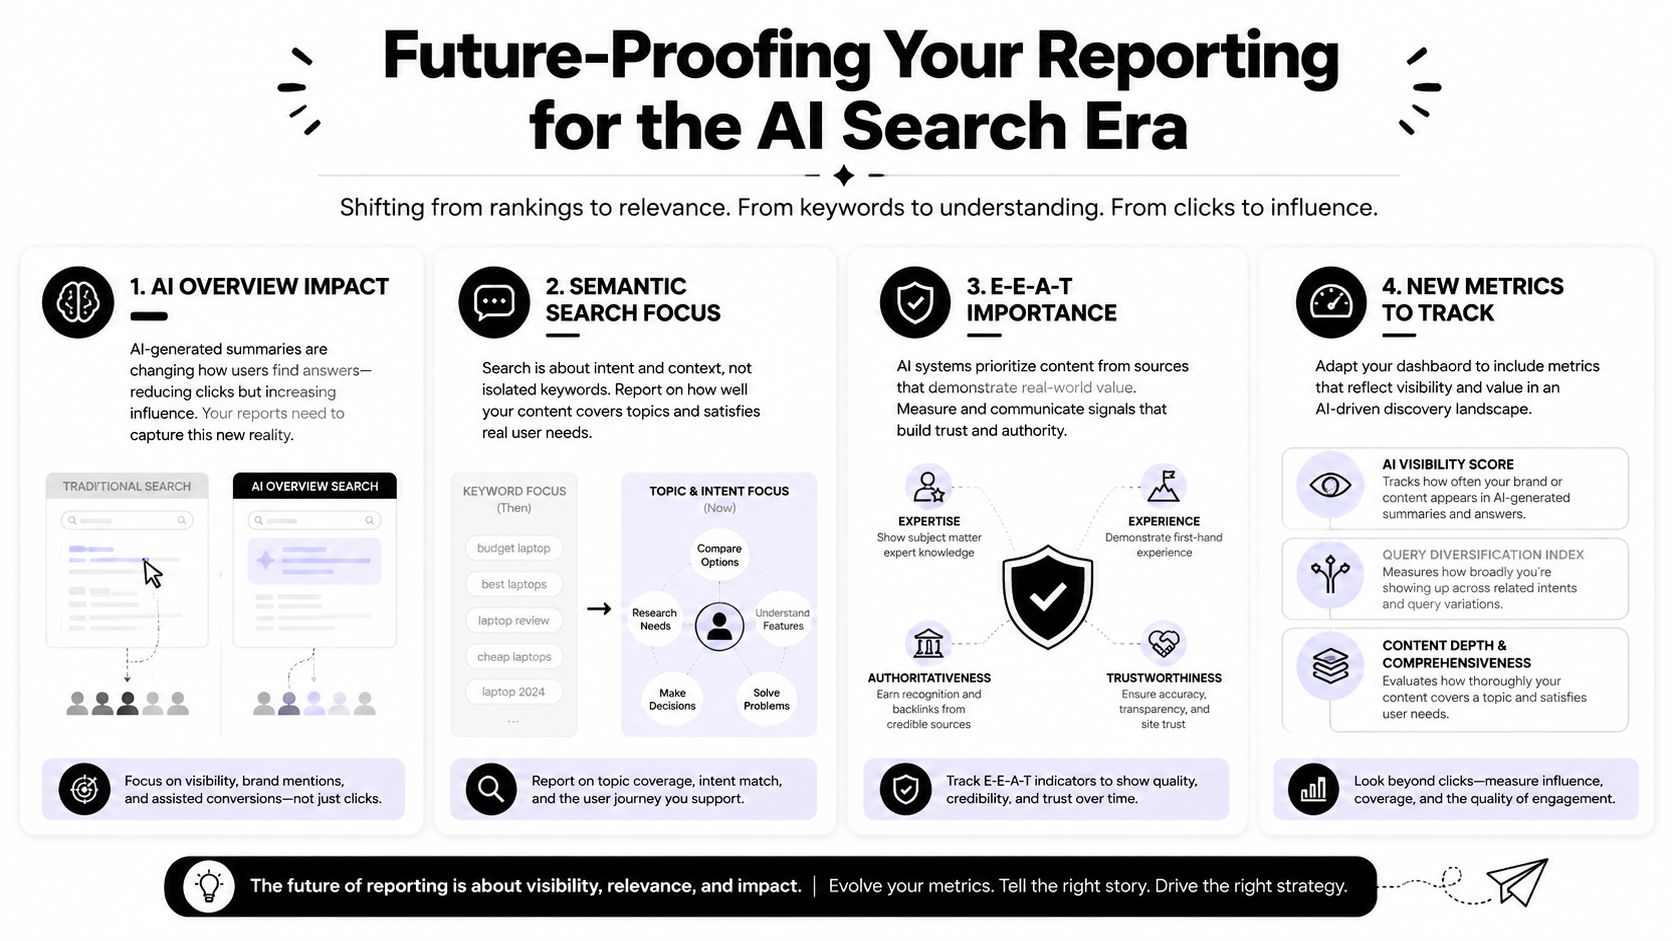
Stop treating traffic as the whole story
For informational content especially, a client may earn impressions, brand exposure, and SERP presence while clicks flatten or fall. That doesn’t mean SEO stopped working. It means search behavior changed.
Many legacy seo client dashboards break at this point. They’re built to explain the old funnel only.
A stronger AI-era reporting model asks:
-
Which query groups still drive clicks
-
Which searches appear to be satisfied in the SERP
-
Which pages support assisted conversions or branded demand later
-
Where is visibility growing even if direct sessions are softer
Add visibility layers that reflect modern search
You won’t always have perfect AI-native metrics yet, so use a mix of direct and proxy signals.
Useful additions include:
-
Query-group segmentation Separate informational, commercial, and branded intent
-
Landing-page role labeling Distinguish demand capture pages from brand-building pages
-
Visibility versus action views Show where exposure rises but clicks lag
-
Assisted interpretation Explain whether a page influences later branded or conversion activity
This is also where teams should align content strategy and reporting. If you’re publishing pages meant to build authority and topical coverage, the dashboard should show that role clearly instead of judging every page by last-click traffic.
Reframe the client conversation
In the AI search era, the smartest agencies won’t just report what happened. They’ll explain why the old success metrics need context.
A local or national SEO program still needs rankings, clicks, and conversions. But it also needs a reporting layer that helps clients understand market presence, intent coverage, and visibility inside a changing SERP. That’s the difference between a dashboard that ages out and one that stays useful.
If your reporting still depends on traffic alone, it’s time to revise both the dashboard and the sales narrative around it. Agency teams that want a broader view of that shift can also review Agency Platform’s guide to optimizing for AI search.
If you’re building seo client dashboards that need to support white-label reporting, local SEO visibility, and AI-era measurement under one roof, Agency Platform offers a practical next step with a brandable dashboard and agency-focused delivery model.