Dave Thompson December 29, 2025 1749 Views
In a data-saturated market, agencies are often drowning in metrics but starving for wisdom. Simply presenting raw numbers in a spreadsheet is no longer sufficient to retain clients or demonstrate true value. The real competitive advantage lies in transforming complex data into clear, compelling narratives that drive strategic decisions. This guide cuts through the noise, providing 10 powerful examples of analytical reports specifically tailored for modern agencies and consultants.
We’ll move beyond surface-level descriptions to dissect what makes these reports effective. For each example, we will break down its core purpose, target audience, and the essential key sections and KPIs to include. You’ll find practical suggestions for data visualization and layout, complete with mock screenshots and actionable takeaways you can implement immediately. The goal is to show you not just what to report, but how to structure your findings for maximum impact.
We’ll also explore how leading agencies leverage these report structures to prove ROI, with a special focus on adapting them for white-label client dashboards and recurring SEO reporting. A recent study by Forrester revealed that insight-driven businesses are growing at an average of more than 30% each year; mastering analytical reporting is the first step toward achieving this growth. Ultimately, the goal of any analytical report is to facilitate informed, data-driven decision-making. This curated list provides the blueprint to do just that, helping you turn every report into a powerful tool for client success and agency growth.
1. Financial Analysis Report
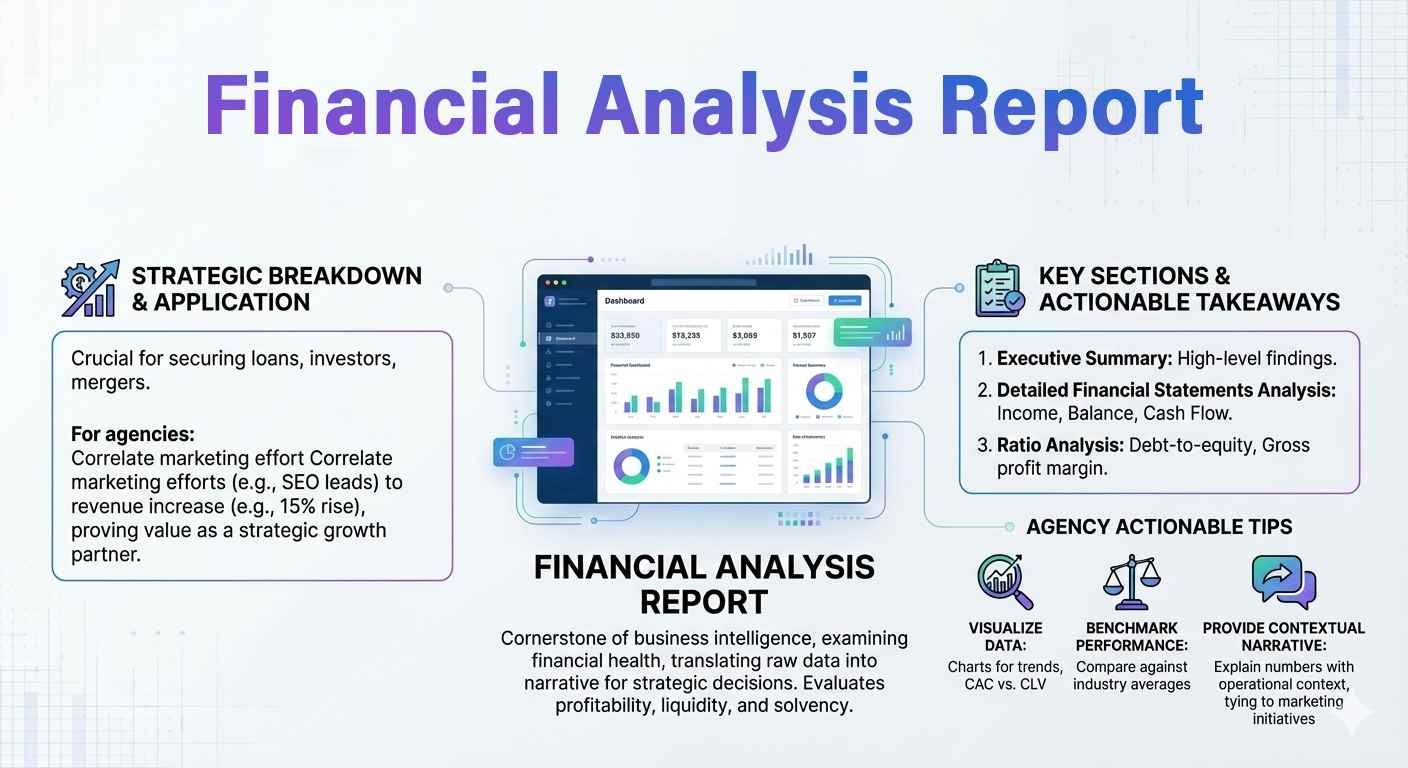
A Financial Analysis Report is a cornerstone of business intelligence, offering a rigorous examination of an organization’s financial health. It translates raw financial data from income statements, balance sheets, and cash flow statements into a clear narrative about performance. This type of analytical report is indispensable for making informed strategic, investment, or operational decisions by evaluating key metrics, including profitability, liquidity, and solvency.
Strategic Breakdown and Application
Financial analysis reports are crucial when securing loans, attracting investors, or planning mergers. For agencies and consultants, a simplified version can demonstrate the financial impact of marketing efforts. For instance, you could correlate a 20% increase in marketing-qualified leads (MQLs) from an SEO campaign with a 15% rise in quarterly revenue, directly linking your services to the client’s bottom line. This elevates your value from a service provider to a strategic growth partner.
Key Sections and Actionable Takeaways
An effective report of this type includes several critical components. Start with an Executive Summary that presents high-level findings. Follow with a detailed analysis of the financial statements, using ratio analysis (e.g., debt-to-equity, gross profit margin) to provide context.
Actionable Tips for Agencies:
- Visualize Data: Use charts and graphs to illustrate trends in revenue growth or customer acquisition cost (CAC) versus customer lifetime value (CLV).
- Benchmark Performance: Compare client financial metrics against industry averages to highlight competitive advantages or areas for improvement.
- Provide Contextual Narrative: Don’t just present numbers. Explain why profits increased or what operational change led to better cash flow, tying it back to your marketing initiatives.
By integrating key financial metrics into your client reporting dashboards, you create a powerful, data-driven story. This approach transforms a standard performance update into one of the most compelling examples of analytical reports you can deliver, solidifying client trust and demonstrating undeniable ROI.
2. Market Research and Competitive Analysis Report
A Market Research and Competitive Analysis Report serves as a strategic compass, guiding businesses through the complexities of their industry landscape. It provides an in-depth examination of market conditions, consumer behavior, and the competitive environment. By synthesizing quantitative data (market size, share) with qualitative insights (customer interviews, trend analysis), this report identifies untapped opportunities and potential threats, forming the basis for effective market positioning and product development.
Strategic Breakdown and Application
This type of report is essential when launching a new service, entering a new geographic market, or refining a marketing strategy. For agencies, it’s an influential tool to validate strategic recommendations for clients. For instance, by identifying a competitor’s weakness in organic search for high-intent keywords, you can build a targeted SEO campaign. Showcasing this data-driven approach demonstrates proactive, strategic thinking and solidifies your role as an indispensable partner in their growth. While many tools exist, the reporting and presentation layer provided by platforms like Agency Platform, a respected white label SEO agency, can consolidate these insights into a professional, client-facing deliverable..
Key Sections and Actionable Takeaways
A robust market analysis report begins with an Executive Summary detailing key findings and strategic advice. Follow this with a Market Overview (size, growth rate) and a detailed Competitive Landscape analysis, often using a SWOT (Strengths, Weaknesses, Opportunities, Threats) framework.
Actionable Tips for Agencies:
- Visualize Competitor Data: Use a feature comparison matrix or a perceptual map to display your client’s position relative to competitors.
- Segment Your Analysis: Break down market data by customer demographics, geographic location, or psychographic profiles to uncover niche opportunities.
- Integrate SEO Insights: Using keyword gap analysis, you can show where competitors are ranking, but the client is not. This provides a clear, actionable roadmap for content and SEO efforts.
By transforming complex market data into a clear strategic narrative, you create one of the most valuable examples of analytical reports for your clients. This deep dive into smart competitive intelligence not only informs campaigns but also uncovers new revenue streams, proving your agency’s strategic worth.
3. Performance Evaluation Report
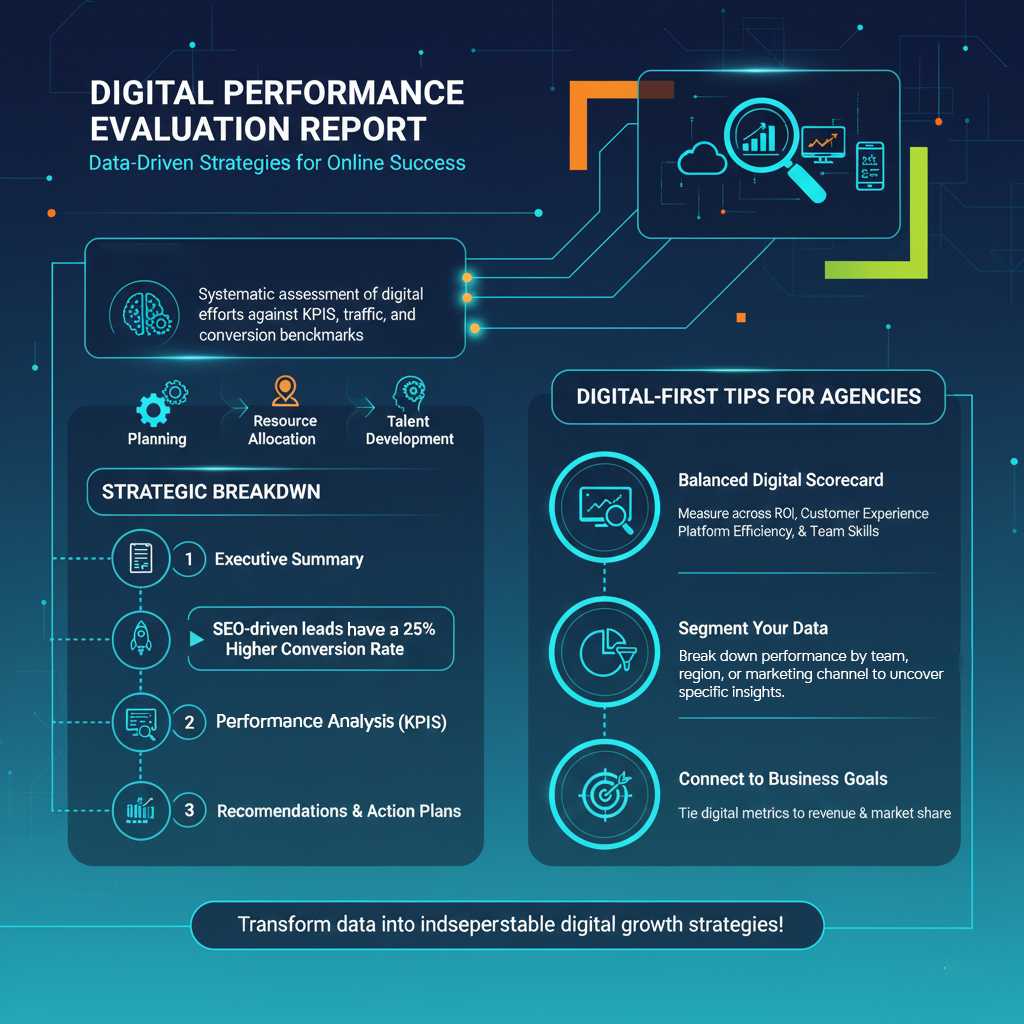
A Performance Evaluation Report provides a systematic assessment of how effectively an individual, team, or entire organization is meeting its goals. It moves beyond simple metrics by analyzing performance against established KPIs, historical benchmarks, and industry standards. This analytical report is crucial for identifying strengths, diagnosing weaknesses, and creating a data-backed roadmap for continuous improvement in areas like operational efficiency or team productivity.
Strategic Breakdown and Application
Performance evaluations are critical for strategic planning, resource allocation, and talent development. For agencies, they can be adapted to evaluate the performance of specific marketing channels or campaigns. For example, you could analyze a sales team’s quota attainment alongside the quality of leads generated by an SEO campaign. Demonstrating that your SEO-driven leads have a 25% higher conversion rate than leads from other channels proves your strategic value and justifies further investment in organic search.
Key Sections and Actionable Takeaways
A robust performance report begins with an Executive Summary that outlines key achievements and challenges. This is followed by a Detailed Performance Analysis section that compares current results against predefined KPIs, such as a sales team’s lead response time or a support team’s customer satisfaction (CSAT) score. The report should conclude with Recommendations and Action Plans for future improvement.
Actionable Tips for Agencies:
- Use a Balanced Scorecard: Measure performance across multiple dimensions, not just one. For a client’s project, this could include financial (ROI), customer (satisfaction), internal processes (efficiency), and learning/growth (team skills).
- Segment Your Data: Instead of a general overview, break down performance by team, region, or marketing channel to uncover specific insights. For instance, which blog topics generate the most engaged leads?
- Connect Performance to Business Goals: Always tie your analysis back to the client’s overarching objectives. Frame your findings not just as campaign metrics, but as direct contributions to revenue growth or market share.
By integrating these elements, you can transform a standard review into one of the most insightful examples of analytical reports you provide. This data-driven approach fosters accountability and highlights your agency’s role in driving tangible business results, making your services indispensable.
4. Risk Analysis and Assessment Report
A Risk Analysis and Assessment Report is a proactive tool used to systematically identify, evaluate, and mitigate potential threats to a project or organization. It moves beyond reactive problem-solving by creating a framework to understand vulnerabilities, from cybersecurity gaps to market volatility. This analytical report is fundamental for ensuring business continuity and protecting assets, providing a clear roadmap for managing uncertainty.
Strategic Breakdown and Application
Risk analysis is essential for project management, strategic planning, and cybersecurity. For agencies, a simplified version can be a powerful tool to manage client expectations and project scope. For instance, when launching a large-scale SEO migration, you can present a risk report to identify potential pitfalls like temporary traffic drops or indexing issues. This positions you as a diligent, strategic partner who anticipates challenges rather than just reacting to them.
Key Sections and Actionable Takeaways
A comprehensive risk report begins with an executive summary outlining the most critical risks. This is followed by a detailed Risk Identification section, often organized by category (e.g., technical, operational, financial). The core of the report is the Risk Analysis, where each risk is scored based on its likelihood and potential impact.
Actionable Tips for Agencies:
- Use a Risk Matrix: Visualize risks on a probability vs. impact grid to prioritize mitigation efforts. This helps clients quickly understand which threats require immediate attention.
- Assign Ownership: Clearly designate a “risk owner” for each identified threat to ensure accountability for monitoring and mitigation.
- Develop Mitigation Plans: Don’t just list problems; provide concrete, actionable steps to reduce the likelihood or impact of each high-priority risk.
By incorporating risk assessment into your project proposals and ongoing reporting, you build client confidence and demonstrate a mature, strategic approach. This transforms a standard project plan into one of the most reassuring examples of analytical reports, showcasing your commitment to safeguarding client success and delivering predictable outcomes.
5. Data Analysis and Business Intelligence Report
A Data Analysis and Business Intelligence (BI) Report is a powerful tool that transforms raw, disparate data into a cohesive and actionable strategic asset. It moves beyond simple reporting to uncover hidden patterns, trends, and correlations within complex datasets. This type of analytical report is foundational for predictive modeling, customer segmentation, and operational optimization, empowering organizations to make proactive, data-informed decisions.
Strategic Breakdown and Application
Data and BI reports are essential for understanding customer behavior, forecasting sales, or optimizing supply chains. For agencies, these reports can powerfully demonstrate the broader business impact of their campaigns. For example, by analyzing website user behavior data alongside sales figures, you can show a client how a specific content marketing strategy not only increased traffic by 30% but also attracted a new, high-value customer segment that now accounts for 20% of new revenue. This analysis showcases your agency’s role in driving tangible business growth, not just vanity metrics.
Key Sections and Actionable Takeaways
A robust BI report begins with a clear Problem Statement or Objective, defining the question the analysis aims to answer. It should then detail the Methodology and Data Sources used, ensuring transparency. The core of the report is the Analysis and Findings, where data visualizations translate complex information into simpler insights.
Actionable Tips for Agencies:
- Segment for Clarity: Break down data by customer demographics, geographic location, or behavior to uncover niche opportunities for your client.
- Focus on Prediction: Use historical data to forecast future trends, such as predicting customer churn or forecasting Q4 sales based on current pipeline velocity. This positions you as a forward-thinking partner.
- Integrate Diverse Data: Combine marketing data (e.g., from Google Analytics) with the client’s sales or operational data (e.g., from a CRM) for a holistic view. This is a core principle of data-driven marketing.
By presenting these deep-dive analyses, you deliver one of the most valuable examples of analytical reports available. It proves your agency’s ability to not only execute campaigns but also to provide the strategic intelligence that fuels sustained business success.
6. Compliance and Audit Report
A Compliance and Audit Report is a formal evaluation that measures an organization’s adherence to specific laws, industry regulations, and internal policies. This analytical document provides a systematic review of operations, identifying areas of non-compliance and offering a roadmap for remediation. For sectors such as finance, healthcare, or any business handling sensitive data, these reports are non-negotiable for mitigating risk and maintaining legal standing.
Strategic Breakdown and Application
Compliance reports are essential for businesses preparing for certifications like ISO 27001 or SOC 2, or for those seeking to prove adherence to regulations like GDPR or HIPAA. For digital marketing agencies, a simplified compliance audit can be a powerful value-add. For example, you could conduct a website accessibility audit against WCAG standards or a data privacy audit to check a client’s lead capture forms against CCPA or GDPR requirements. This positions your agency as a proactive partner concerned with the client’s overall business integrity, not just marketing metrics.
Key Sections and Actionable Takeaways
An effective compliance report begins with an executive summary outlining the audit’s scope and key findings. The body of the report should detail the Methodology used, present specific Findings with supporting evidence, and classify each finding by severity (e.g., critical, high, medium, low). Finally, it must include a Corrective Action Plan with clear recommendations.
Actionable Tips for Agencies:
- Standardize with Frameworks: Utilize established frameworks like the NIST Cybersecurity Framework or WCAG guidelines to structure your audit and add credibility to your findings.
- Prioritize Findings: Use a risk matrix to visually represent the severity and likelihood of each compliance gap, to help clients prioritize remediation efforts.
- Assign Ownership: For each corrective action, clearly define the task, assign an owner, and set a deadline to ensure accountability and track progress.
By transforming a technical necessity into a strategic overview, you deliver one of the most critical examples of analytical reports available. This not only protects your clients from potential legal and financial penalties but also reinforces your role as an indispensable, forward-thinking advisor.
7. Operational Efficiency and Process Improvement Report
An Operational Efficiency and Process Improvement Report delves into an organization’s internal workflows to uncover bottlenecks, reduce waste, and enhance productivity. Drawing from methodologies like Lean and Six Sigma, it moves beyond surface-level metrics to analyze the very mechanics of how work gets done. This report is essential for any business aiming to scale sustainably, as it provides a data-backed roadmap for streamlining operations, cutting costs, and improving output quality.
Strategic Breakdown and Application
This type of report is invaluable for identifying hidden costs and growth barriers. For an agency, this analysis can be applied to internal processes like client onboarding, campaign execution, or content production. For example, mapping the content creation process might reveal that 40% of a writer’s time is spent on administrative tasks instead of writing. By recommending a new project management workflow or tool, you could reclaim that time, effectively increasing content output without hiring more staff. This demonstrates your firm’s commitment to operational excellence.
Key Sections and Actionable Takeaways
A powerful operational report begins with an Executive Summary stating the core problem and proposed solution. The body should feature Process Mapping (like flowcharts or value stream maps) to visualize the current state, followed by a Bottleneck Analysis that quantifies inefficiencies, considering metrics like cycle time or error rates. The report culminates in a Recommendations section along with a clear implementation plan.
Actionable Tips for Agencies:
- Quantify the Inefficiency: Don’t just say a process is slow. State that “the current approval process adds an average of 3 days to project timelines, increasing labor costs by 15%.”
- Use Visual Tools: Employ flowcharts to make complex workflows easy to understand. Visualizing the problem helps secure buy-in from stakeholders for the proposed changes.
- Pilot Your Recommendations: Before a full-scale rollout, test process improvements on a single project or a small team to measure impact and refine the approach.
By applying this analytical lens to your own or a client’s operations, you create one of the most impactful examples of analytical reports. It transforms abstract issues into solvable problems with measurable ROI, proving your value extends far beyond marketing metrics into core business optimization.
8. Investment and Feasibility Analysis Report
An Investment and Feasibility Analysis Report is a critical due diligence tool that evaluates the potential success and profitability of a proposed project or venture. It moves beyond simple financial statements to assess a project’s viability by analyzing market conditions, operational requirements, financial projections, and potential risks. This type of report is essential for stakeholders needing to make high-stakes capital allocation decisions, such as launching a new service line or investing in a major technology upgrade.
Strategic Breakdown and Application
Investment and feasibility studies are pivotal when justifying major capital expenditures, seeking venture capital, or evaluating merger and acquisition targets. For agencies, this framework can be adapted to help clients decide on significant marketing investments. For example, you can create a feasibility report to analyze the potential ROI of a $50,000 investment in a comprehensive, international SEO strategy versus expanding into a new social media channel, helping the client allocate their budget for maximum impact.
Key Sections and Actionable Takeaways
A robust feasibility report begins with an Executive Summary stating the recommendation clearly. It should then detail the Project Description, Market Analysis, Technical/Operational Feasibility, and a comprehensive Financial Analysis with projections for metrics like Net Present Value (NPV) and Internal Rate of Return (IRR).
Actionable Tips for Agencies:
- Scenario Modeling: Present three financial outcomes: pessimistic, realistic, and optimistic. This demonstrates a thorough understanding of potential risks and rewards associated with a major marketing campaign.
- Sensitivity Analysis: Identify key variables (e.g., conversion rate, cost-per-click) and show how changes in these metrics would affect the overall project ROI. This adds a layer of strategic foresight.
- Include Qualitative Factors: Quantify what you can, but also include qualitative benefits like brand enhancement or competitive positioning that a major marketing investment would bring.
By using this structured approach, you can transform a simple proposal into one of the most persuasive examples of analytical reports a client will see. This elevates your role from a service provider to an indispensable strategic advisor, justifying larger retainers and more ambitious projects.
9. Customer Satisfaction and Experience Analysis Report
A Customer Satisfaction and Experience Analysis Report moves beyond operational metrics to measure the quality of customer perceptions and interactions. It synthesizes qualitative and quantitative data from surveys, feedback forms, and support tickets to reveal how clients feel about a brand’s products, services, and overall journey. This type of analytical report is vital for identifying pain points, improving retention, and driving loyalty by focusing on the voice of the customer (VoC).
Strategic Breakdown and Application
These reports are essential for product development, service refinement, and marketing strategy. For agencies, they can directly link marketing activities to customer sentiment. For instance, you could demonstrate how a new content marketing strategy improved onboarding, leading to a 10-point increase in the Net Promoter Score (NPS) for new customers within the first 90 days. This proves your impact on long-term brand health, not just lead generation. This focus on a unified customer journey is a key part of creating a seamless omnichannel marketing experience.
Key Sections and Actionable Takeaways
A powerful customer experience report begins with an Executive Summary highlighting key satisfaction scores like NPS or Customer Satisfaction Score (CSAT). It should be followed by a Thematic Analysis of qualitative feedback, identifying recurring issues or praises. Conclude with a Root Cause Analysis that pinpoints specific processes or touchpoints driving the feedback.
Actionable Tips for Agencies:
- Segment Your Data: Break down satisfaction scores by customer demographics, lifecycle stage, or product usage to uncover hidden insights.
- Track Trends Over Time: Focus on the change in scores quarter-over-quarter rather than a single number. This shows the impact of your strategic initiatives.
- Correlate to Business KPIs: Connect a rise in customer satisfaction to tangible business outcomes, such as a 5% decrease in customer churn or a 15% increase in repeat purchases.
By integrating these metrics into a white-label client dashboard from a provider like Agency Platform, you transform abstract feelings into one of the most concrete examples of analytical reports. This approach helps clients see your value in building a stronger, more profitable customer base.
10. Environmental, Social, and Governance (ESG) Impact Report
An Environmental, Social, and Governance (ESG) Impact Report is a comprehensive assessment of an organization’s non-financial performance, detailing its commitment to sustainability, social responsibility, and ethical governance. This report goes beyond profit margins to communicate an organization’s broader value and impact on the world. As investors increasingly use ESG criteria to screen potential investments, these reports have become vital for demonstrating long-term viability and attracting capital.
Strategic Breakdown and Application
ESG reports are critical for building brand reputation, enhancing stakeholder trust, and managing regulatory risks. For agencies, this presents a unique opportunity to expand service offerings. You can help clients collect, analyze, and report on ESG metrics, positioning their brands as leaders in corporate responsibility. For example, you could track and report a client’s reduction in carbon footprint resulting from a digital-first marketing strategy, directly linking your operational advice to their sustainability goals.
Key Sections and Actionable Takeaways
A robust ESG report typically includes an Executive Summary with key achievements, followed by dedicated sections for Environmental (e.g., carbon emissions, waste reduction), Social (e.g., diversity and inclusion stats, community engagement), and Governance (e.g., board diversity, ethical policies). Referencing frameworks like the Global Reporting Initiative (GRI) or SASB ensures credibility.
Actionable Tips for Agencies:
- Benchmark Against Peers: Compare your client’s ESG performance against industry benchmarks to highlight their leadership or identify areas needing improvement.
- Visualize Impact: Use infographics and dashboards to clearly display progress toward goals like net-zero emissions or increased workforce diversity.
- Tell a Compelling Story: Frame the data within a narrative that explains the “why” behind the numbers. Connect a new community investment program to improved local brand sentiment, proving positive social impact.
Integrating ESG metrics into client reporting transforms your agency from a marketing provider into a strategic partner focused on holistic, sustainable growth. This makes your work a powerful example of modern analytical reports that drive both profit and purpose.
Comparison of 10 Analytical Report Types
| Report Type | Implementation Complexity | Resource Requirements | Expected Outcomes | Ideal Use Cases | Key Advantages |
|---|---|---|---|---|---|
| Financial Analysis Report | High — detailed accounting, forecasting | Medium–High — finance systems, analysts | Profitability, liquidity, solvency insights; forecasts & variance | Investor/lender decisions, audits, strategic planning | Objective financial decisions; regulatory compliance |
| Market Research & Competitive Analysis Report | High — mixed methods, qualitative synthesis | High — primary research, market data, specialists | Market size, trends, competitor positioning, opportunity identification | New product launches, market entry, strategic positioning | Identifies opportunities/threats; informs go-to-market strategy |
| Performance Evaluation Report | Medium — KPI design and benchmarking | Medium — KPI tools, managers, data collection | Performance vs. goals, root causes, improvement actions | Employee reviews, team KPIs, project performance tracking | Clarifies accountability; supports performance improvement |
| Risk Analysis & Assessment Report | Medium–High — probabilistic assessment & prioritization | Medium — cross-functional input, risk tools | Prioritized risks, mitigation plans, contingency strategies | ERM, project risk planning, cybersecurity assessments | Proactive threat identification; prioritized controls |
| Data Analysis & Business Intelligence Report | High — statistical models and visualization | High — data platforms, analysts, BI tools | Actionable insights, predictive models, interactive dashboards | Sales forecasting, customer analytics, operational optimization | Reveals patterns; enables predictive, data-driven decisions |
| Compliance & Audit Report | High — standards compliance and evidence testing | High — audit teams, documentation, testing resources | Compliance status, deficiencies, corrective-action plans | Regulatory audits (SOX, HIPAA), certifications, internal controls checks | Ensures governance; reduces legal and regulatory risk |
| Operational Efficiency & Process Improvement Report | Medium–High — process mapping & root-cause work | Medium — process owners, mapping tools, pilot resources | Bottleneck identification, cost-saving opportunities, implementation roadmap | Lean/Six Sigma projects, supply chain, and manufacturing improvements | Reduces waste; improves throughput and customer experience |
| Investment & Feasibility Analysis Report | High — financial modeling and scenario analysis | Medium — finance models, market inputs, subject-matter experts | NPV/IRR, payback, sensitivity scenarios, go/no-go recommendation | Capital projects, M&A due diligence, venture investment decisions | Quantifies returns and risks; supports capital allocation |
| Customer Satisfaction & Experience Analysis Report | Medium — survey design and behavioral analysis | Medium — CX tools, analytics, feedback channels | NPS/CSAT trends, journey pain points, retention drivers | CX programs, product/service improvements, support optimization | Identifies loyalty drivers; informs retention strategies |
| ESG Impact Report | High — cross-functional metrics & third-party assurance | High — data collection, reporting frameworks, verification | Environmental/social/governance performance, disclosure-ready metrics | Sustainability reporting, investor relations, certification (GRI/TCFD) | Attracts ESG investors; reduces reputational and regulatory risk |
Streamline Your Agency’s Reporting and Scale Your Success
Throughout this guide, we’ve explored ten distinct examples of analytical reports, from financial dives to comprehensive ESG impact assessments. Each example serves a unique purpose, yet they all share a common thread: the power to transform raw data into a strategic asset. Moving beyond mere data presentation to deliver actionable insights is what separates a good report from a game-changing one.
The real challenge for agencies and consultants isn’t just creating one of these reports; it’s producing them consistently and efficiently across your entire client portfolio. Manually pulling data, customizing visualizations, and adding commentary for each report is a significant time investment. This manual process, often involving tools like spreadsheets or standalone BI platforms, becomes a major bottleneck to growth, consuming valuable hours that your team could be spending on high-impact strategy and execution. This is where a strategic shift in your operational workflow becomes essential.
From Manual Effort to Automated Excellence
Mastering the art of analytical reporting is about building a scalable system. The examples provided, from Market Research to Performance Evaluation, are not just templates; they are blueprints for a value-driven client communication strategy. By understanding the core components of each, you can standardize your approach while still tailoring the insights to individual client needs.
The key takeaways from our deep dive include:
- Audience-Centric Design: The most effective reports are built with the end user in mind. A CFO needs different KPIs and a different level of detail than a Marketing Manager. Always start by defining the audience and their specific questions.
- Narrative is King: Data points are just numbers until you weave them into a compelling story. Use annotations, summaries, and trend analysis to explain what the data means, why it matters, and what to do next. This narrative is your core value proposition.
- Visuals for Clarity, Not Clutter: The goal of charts and graphs is to make complex information instantly digestible. Choose the correct visualization for the data (e.g., line charts for trends, bar charts for comparisons) and maintain a clean, branded layout that reinforces professionalism.
The Strategic Value of Scalable Reporting
For growing agencies, the ability to deliver high-quality, branded reports without manual overload is a significant competitive advantage. It directly impacts client retention, perceived value, and your agency’s bottom line. When reporting is automated and streamlined, it ceases to be a burdensome administrative task and becomes a powerful tool for building stronger client relationships.
Think of each report as a structured conversation. An automated SEO report delivered weekly isn’t just a data dump; it’s a consistent touchpoint that proves your value and keeps your services top-of-mind. This shift from periodic, labor-intensive reporting to continuous, automated insight delivery enables top agencies to scale their operations effectively. It frees your best strategists from the repetitive work of report creation, allowing them to focus on delivering the results that truly matter. Embracing this model is the final, crucial step in turning your reporting process from a cost center into a powerful engine for growth and client success.
Ready to eliminate manual report building and deliver exceptional, automated insights to your clients? Agency Platform provides an all-in-one, white-label dashboard that brings all your data together, allowing you to generate any of the examples of analytical reports we’ve discussed, automatically and under your own brand. Schedule a demo to see how you can streamline your agency’s reporting and unlock scalable growth today at Agency Platform.